

Scraping Browser Debugger
Web scraping projects often require intricate interactions with target websites and debugging is vital for identifying and resolving issues found during the development process. The Scraping Browser Debugger serves as a valuable resource, enabling you to inspect, analyze, and fine-tune your code alongside Chrome Dev Tools, resulting in better control, visibility, and efficiency.Where to find it
Our Scraping Browser Debugger can be launched via two methods:- Manually via Control Panel
- Remotely via your script
- Manually via Control Panel
- Remotely via your script
The Scraping Browser Debugger can be easily accessed within your Bright Data Control Panel. Follow these steps: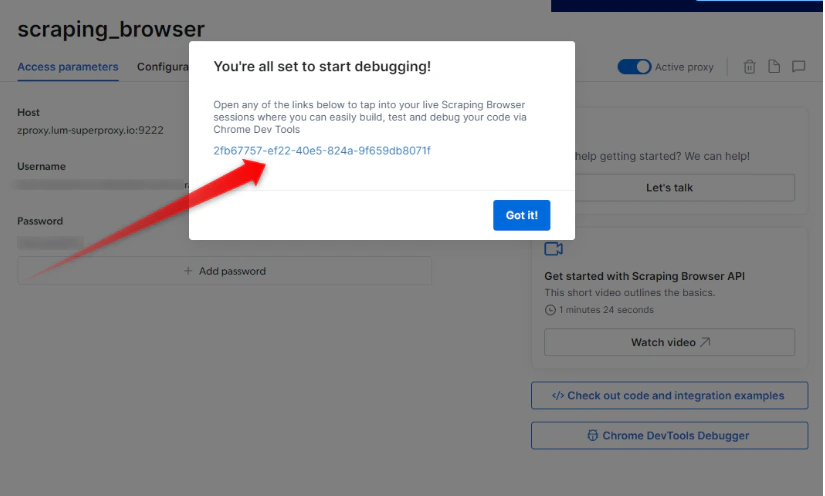
- Within the control panel, go to My Zones
- Click on your specific Scraping Browser zone
- Click on the Overview tab
-
On the right side, Click on the “Chrome Dev Tools Debugger” button seen below:
Getting Started with the Debugger & Chrome Dev Tools
1
Open a Scraping Browser Session
- Ensure you have an active Scraping Browser session
- If you don’t yet know how to launch a scraping browser session, see our Quick Start guide.
2
Launch the Debugger
- Once your session is up and running you can now launch the Debugger.
- Click on the Debugger button within your ‘Access parameters’ tab to launch the Scraping Browser Debugger interface (see the screenshot above )
3
Connect with your live browser sessions
- Within the Debugger interface, you will find a list of your live Scraping Browser sessions.
- Select the preferred session that you wish to debug
- Click on the session link or copy/paste it into your browser of choice, and this will establish a connection between the Debugger and your selected session.
Leveraging Chrome Dev Tools
- With the Scraping Browser Debugger now connected to your live session, you gain access to the powerful features of Chrome Dev Tools.
- Utilize the Dev Tools interface to inspect HTML elements, analyze network requests, debug JavaScript code, and monitor performance. Leverage breakpoints, console logging, and other debugging techniques to identify and resolve issues within your code.
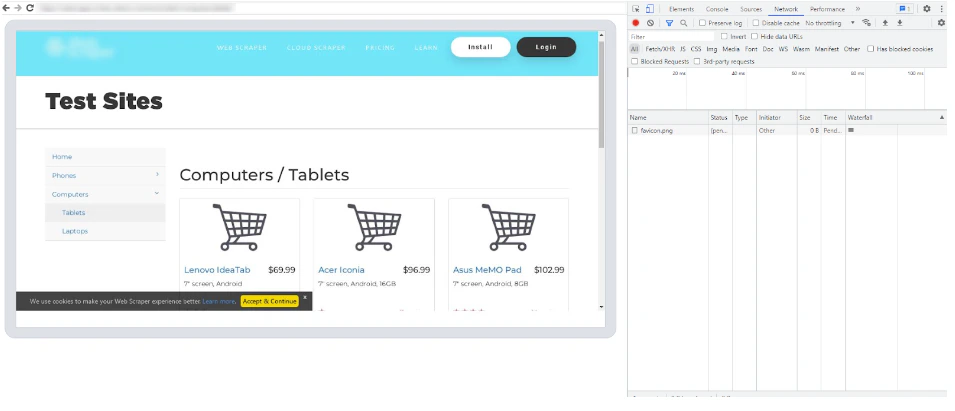
Automatically opening devtools locally to view your live browser session
If you would like to automatically launch devtools on every session to view your live browser session, you can integrate the following code snippet:NodeJS - Puppeteer